How to monitor BGP sessions with Nagios
I had originally written this tutorial for xmodulo.com
As a versatile network monitoring tool, Nagios can monitor the health of various network elements such as routers and switches. Among others, Nagios can be configured to monitor BGP sessions of a router, and generate alerts whenever there is something wrong in existing BGP sessions.
Several BGP monitoring plugin tools exist for Nagios. These tools are useful in monitoring critical BGP peers of a router, and generating alerts for them. This tutorial will explain how to monitor BGP neighbors using Nagios plugin tools.
Tested Platforms
- Tested and working perfectly with Cisco ASR 1000 series routers.
- Tested and working perfectly with Cisco 3700 series layer-3 switches.
- Should work with other Cisco devices as well.
- Tested and does NOT work with Quagga routers.
- Not tested on JunOS.
Tested Topology
Nagios will monitor all the BGP sessions for router-1. BGP neighbors AS 50 and AS 70 are vital for operation, so a separate script will be used to monitor these specific neighbors and generate alerts in case they become unreachable.

Create a Host for Router-1 in Nagios
Before we start, we will define a host for router-1 as follows.
# vim /etc/nagios3/conf.d/bgp-host.cfg
define host{
        use                     generic-host
        host_name               router-1
        alias                   router-1
        address                 100.100.100.100
        }
Monitor All BGP Sessions of Router-1
Nagios comes with a built-in tool called check_bgpstate to check the BGP state of a router using SNMP. This tool can be manually run to check router-1 by providing necessary parameters.
# /usr/lib/nagios/plugins/check_bgpstate -c myCommunity 100.100.100.100
OK: host '100.100.100.100', sessions up: 4, down: 0, shutdown: 0
Now, we will define a command in Nagios to start monitoring all the BGP sessions of router-1 using this tool.
# vim /etc/nagios-plugins/config/bgp.cfg
define command{
        command_name    check_all_bgp
        command_line    /usr/lib/nagios/plugins/check_bgpstate '$HOSTADDRESS$' -C '$ARG1$'
}
Now that the command is ready, we will define a new service which applies the command to router-1.
# vim /etc/nagios3/conf.d/bgp-service.cfg
define service {
        host_name  router-1
        service_description  All BGP session summary
        check_command  check_all_bgp!myCommunity
        check_interval  1
        use   generic-service
        notification_interval 0 ; set > 0 if you want to be re-notified
}
If additional routers need to be added, all we need to do is define hosts for router-2, router-3 and so on, and apply the command check_all_bgp to each of them just like router-1.
Before restarting Nagios service, verify that all the parameters are configured properly by doing a dry run as follows.
# nagios3 –v /etc/nagios3/nagios.cfg
If everything looks good, we restart Nagios service.
# service nagios3 restart
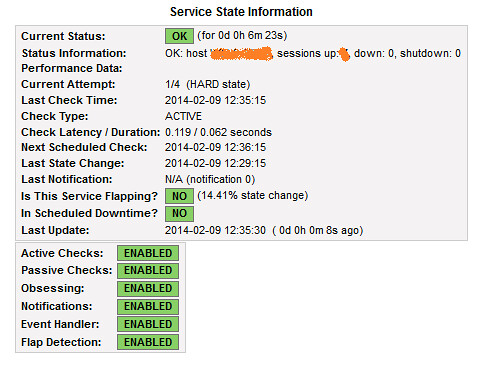
If all goes well, Nagios should be checking the summary of all the BGP sessions, and this can be verified at Nagios portal i.e., http://serverIP/nagios3 > Services
Monitor Particular BGP Neighbor(s) of Router-1
The previous check_bgpstate tool provides alerts only for BGP session summaries i.e., 3 up, 1 down. When any broken BGP session is detected, one needs to login to the router manually, and check which BGP session is down.
For critical BGP neighbors (like AS 50 and AS 70 mentioned in the topology diagram), you may want to monitor individual BGP neighbors. To enable Nagios to monitor and alert for particular BGP neighbors (e.g., AS 50 and AS 70), a separate script called check_bgp is used.
Prepare check_bgp Script
The check_bgp script (latest version 0.4) can be downloaded from the official site. After downloading the script, it is copied and renamed to Nagios plugin directory. Necessary permissions are set to the script as well.
# cp check_bgp.0.4.pl /usr/lib/nagios/plugins/check_bgp.pl
# chmod +x /usr/lib/nagios/plugins/check_bgp.pl
# chmod +x /usr/lib/nagios/plugins/check_bgp.pl
Now that the script is ready, we first do a test run to check the output of the script.
# cd /usr/lib/nagios/plugins/
# ./check_bgp.pl -H 100.100.100.100 -C myCommunity -p 50.50.50.50
# ./check_bgp.pl -H 100.100.100.100 -C myCommunity -p 50.50.50.50
OK – 50.50.50.50 (AS50) state is established(6). Established for Duration.
Now that the script is ready to be used, we go ahead and configure Nagios next.
Preparing Nagios
First we define a command in Nagios, which will check a particular BGP peer.
# vim /etc/nagios-plugins/config/
define command{
        command_name    check_bgp
        command_line    /usr/lib/nagios/plugins/check_bgp.pl -H '$HOSTADDRESS$' -C '$ARG1$' -p '$ARG2$'
}
Now that the command is set up, we define two new services which apply the command to AS 50 and AS 70, respectively.
# vim /etc/nagios3/conf.d/bgp-service.cfg
define service {
        host_name                router-1
        service_description      BGP check with AS 50
        check_command            check_bgp!myCommunity!50.50.50.50
        check_interval           1
        use                      generic-service
        notification_interval    0 ; set > 0 if you want to be re-notified
}

define service {
        host_name                router-1
        service_description      BGP check with AS 70
        check_command            check_bgp!myCommunity!70.70.70.70
        check_interval           1
        use                      generic-service
        notification_interval    0 ; set > 0 if you want to be re-notified
}
Before restarting Nagios service, verify that all the parameters are configured properly by doing a dry run as follows.
# nagios3 –v /etc/nagios3/nagios.cfg
If everything looks good, we restart Nagios service.
# service nagios3 restart
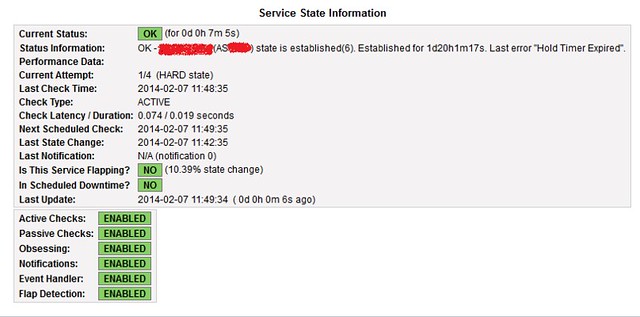
Nagios should start monitoring two BGP neighbors AS 50 and AS 70 in router-1. The status of the two BGP peers can be checked in Nagios portal, i.e., http://serverIP/nagios3 > Services. Nagios will alert if something suspicious is found in either BGP session.
If all goes well, the following screenshot should be visible in Nagios web portal.
Hope this helps.
Comments
Post a Comment