How to monitor common services with Nagios
I had originally written this tutorial for xmodulo.com.
Nagios comes with a wide range of built-in scripts for monitoring services. This tutorial will cover the process of using some of these scripts for checking common services, such as MySQL, Apache web server, DNS, etc.
To keep the article focused on service monitoring, we will not be configuring hostgroups or templates, as they have been covered in a previous tutorial. Nonetheless, they can be tuned to match the requirements.
Running Nagios Check in CLI
It is generally recommended to run the Nagios service check scripts in CLI before adding them to Nagios. This will give an idea on whether the execution will be successful and what the output of the script will look like.
All of the scripts are located at /etc/nagios-plugins/config/ with the executable files stored at/usr/lib/nagios/plugins/
Here is how it is done.
root@nagios:~# cd /etc/nagios-plugins/config/
The provided scripts contain help on the syntax. The example contains partial output.
root@nagios:~# cat /etc/nagios-plugins/config/tcp_udp.cfg
# 'check_tcp' command definition
define command{
        command_name    check_tcp
        command_line    /usr/lib/nagios/plugins/check_tcp -H '$HOSTADDRESS$' -p '$ARG1$'
Now that the syntax is available, TCP port 80 can be checked as follows.
root@nagios:~# /usr/lib/nagios/plugins/check_tcp -H 10.10.10.1 -p 80
TCP OK - 0.000 second response time on port 80|time=0.000222s;;;0.000000;10.000000
Example Topology
In this tutorial, the following three servers are being used. Each server runs one or more common services. The Nagios server is running on Ubuntu.
- Server 1 (10.10.10.1) : MySQL, Apache2
- Server 2 (10.10.10.2) : Postfix, Apache2
- Server 3 (10.10.10.3): DNS
First, the servers are defined in Nagios.
root@nagios:~# vim /etc/nagios3/conf.d/example.cfg
define host{
        use                     generic-host
        host_name               test-server-1
        alias                   test-server-1
        address                 10.10.10.1
        }

define host{
        use                     generic-host
        host_name               test-server-2
        alias                   test-server-2
        address                 10.10.10.2
        }

define host{
        use                     generic-host
        host_name               test-server-3
        alias                   test-server-3
        address                 10.10.10.3
        }
Monitor MySQL Service
MySQL Monitoring Requirements
- Monitor whether MySQL is running by checking port 3306.
- Monitor the availability of certain database 'testDB'.
MySQL Server Setting
When it comes to checking MySQL, it should be kept in mind that MySQL, by default, listens on only the loopback interface 127.0.0.1. This increases the security of the database. Manual tuning is needed to tell MySQL to listen on other interfaces as well. Here is how it can be done.
This setting is done on all MySQL servers.
root@nagios:~# vim /etc/mysql/my.cnf
The following line is commented out to make MySQL listens on all interfaces.
#bind-address = 127.0.0.1
Also, MySQL would not let just any host to connect to it. A user 'nagios' is created for both localhost and for 'any' host. This user is then granted all permission to all databases and will be used for monitoring.
The following settings are done for all MySQL servers.
root@nagios:~# mysql -u root –p
## MySQL root password here ##
## MySQL root password here ##
A user 'nagios@localhost' is created in MySQL server.
mysql> CREATE USER 'nagios'@'localhost' IDENTIFIED BY 'nagios-pass';
mysql> GRANT ALL PRIVILEGES ON *.* TO 'nagios'@'localhost';
mysql> GRANT ALL PRIVILEGES ON *.* TO 'nagios'@'localhost';
A user 'nagios@any-host' is created.
mysql> CREATE USER 'nagios'@'%' IDENTIFIED BY 'nagios-pass';
mysql> GRANT ALL PRIVILEGES ON *.* TO 'nagios'@'%';
mysql> FLUSH PRIVILEGES;
mysql> GRANT ALL PRIVILEGES ON *.* TO 'nagios'@'%';
mysql> FLUSH PRIVILEGES;
This should enable MySQL to listen on all interfaces, as well as accept incoming connections from user 'nagios' at any host.
Note that there are possible security implications of this change, so it's worth mentioning a few words:
- This setting will expose MySQL to all available interfaces, including WAN. It is vital to make sure only legitimate networks have access to the database. Filters such as firewall and TCP wrappers should be used.
- The MySQL 'nagios' user password should be very strong. If there are few Nagios servers, then MySQL user 'nagios@servername' should be created instead of 'nagios@%' i.e., any host.
Nagios Configuration for MySQL
The following tuning should do the trick.
root@nagios:~# vim /etc/nagios3/conf.d/services_nagios2.cfg
define service{
use   generic-service
host_name  test-server-1
;hostgroup can be used instead as well

service_description  Check MYSQL via TCP port
check_command   check_tcp!3306
        }

define service{
use    generic-service
host_name   test-server-1
;hostgroup can be used instead as well

service_description Check availability of database 'testDB'
check_command check_mysql_database!nagios!nagios-pass!testDB
;check_mysql!userName!userPassword!databaseName
        }
This way, Nagios can help monitor the accessibility of both MySQL servers and the database stored within the servers.
Monitor Apache Web Server
Nagios can be used to monitor Apache web server as well.
Apache Monitoring Requirements
- Monitor whether the apache server is available.
This task is really easy as Nagios has a built-in command for this.
root@nagios:~# vim /etc/nagios3/conf.d/services_nagios2.cfg
define service{
use   generic-service
host_name  test-server-1, test-server-2
service_description Check Apache Web Server
check_command  check_http
        }
Now that was really simple.
Monitor DNS Service
Nagios can monitor DNS service by asking the DNS server to either resolve a specific fully qualified domain name (FQDN), or by asking the server to use the dig tool. The default FQDN used for testing is www.google.com, but it can be changed as needed. The following file can be modified to do the job.
root@nagios:~# vim /etc/nagios-plugins/config/dns.cfg
## The -H portion can be modified to replace Google ##
define command{
command_name    check_dns
command_line    /usr/lib/nagios/plugins/check_dns -H www.google.com -s '$HOSTADDRESS$'
}
Then edit the following file.
root@nagios:~# vim /etc/nagios3/conf.d/services_nagios2.cfg
## Nagios asks server-3 to resolve the IP for google.com ##
define service{
use                             generic-service
host_name                       test-server-3
service_description     Check DNS
check_command           check_dns
        }

## Nagios asks server-3 to dig google.com ##
define service{
use                             generic-service
host_name                       test-server-3
service_description     Check DNS via dig
check_command           check_dig!www.google.com
        }
Monitor Mail Server
Nagios can monitor different mail server components like SMTP, POP, IMAP and mailq. As mentioned earlier, server-2 has postfix mail server set up on it. Nagios will be configured to monitor SMTP and mail queue of the server.
root@nagios:~# vim /etc/nagios3/conf.d/services_nagios2.cfg
define service{
use                     generic-service
host_name               test-server-2
service_description     Check SMTP
check_command           check_smtp
        }

define service{
use                     generic-service
host_name               test-server-2
service_description     Check Mail Queue
check_command           check_mailq_postfix!50!100
     ;warning at 50, critical at 100
        }
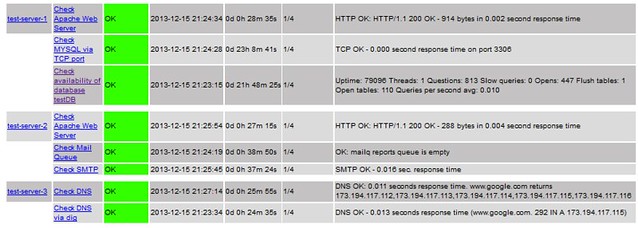
The following screenshot shows a complete overview of all the service checks that have been configured so far.
Port Based Monitoring for Custom Applications
Let us assume that the following custom application is also running in the network, listening on a particular port.
- Test Server 1: custom application (TCP Port 12345)
With a little tweaking, Nagios can help monitor this application port as well.
root@nagios:~# vim /etc/nagios3/conf.d/services_nagios2.cfg
define service{
use                     generic-service
host_name               test-server-1
service_description     Check server 1 custom application
check_command           check_tcp!12345
        }
On a finishing note, Nagios can monitor many other sectors of a network. The scripts stored in /etc/nagios-plugins/config/ can shed some light on the awesome capabilities of Nagios.
Some of the scripts provided with Nagios are restricted to the local server only. Examples include server load, number of concurrent processes, number of logged in users. These checks can provide useful insight on what is going on within the Nagios server.
Hope this helps.
Comments
Post a Comment